


The stock market is expensive — but it’s also cheap


September has been a choppy month for markets — as it often is — and one that has objectively metabolized quite a lot of catalysts. But let’s zoom out for a moment and look at the bigger picture today. This isn’t forward guidance or a prediction — I’m not a prophet — it’s a collection of perspectives on where we stand now that may inform where this stock market goes from here.
Calling this market objectively “cheap” would require some recreational accounting, but calling it subjectively cheap? Not crazy at all. Calling it historically overvalued? Also…not crazy at all. There are plenty of data points to vindicate both perspectives; it just depends on which ones you believe.
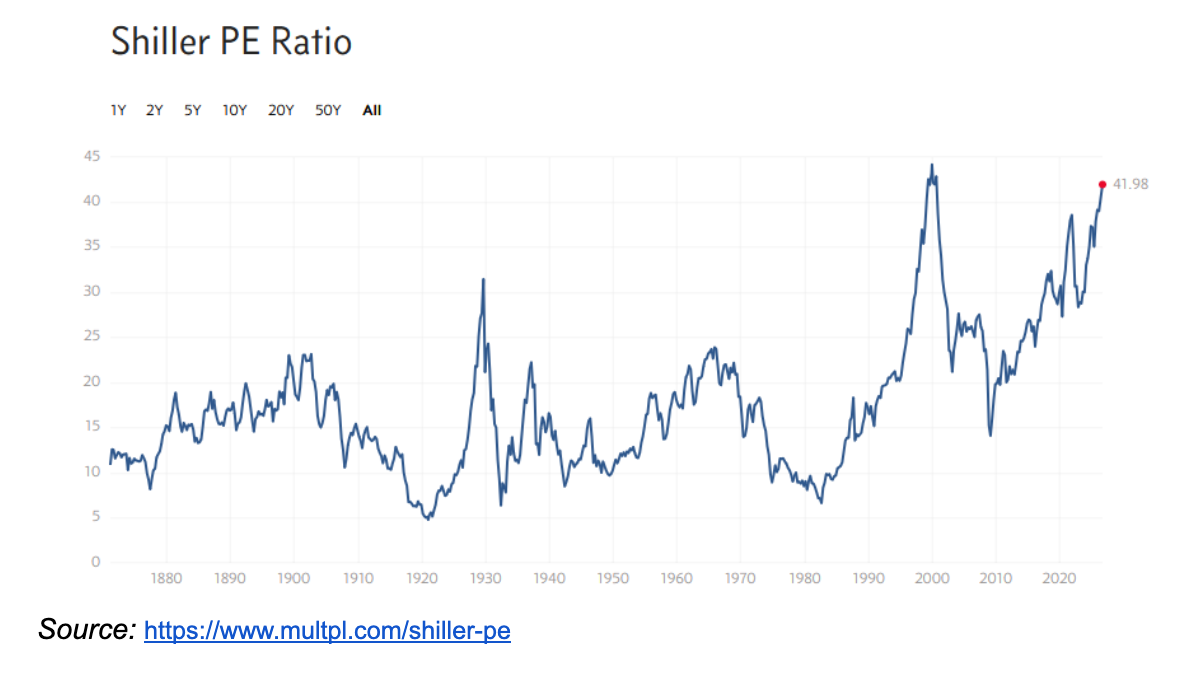
The Shiller CAPE, for example, which measures a stock's value against its prior ten years of earnings history, is near ~41 right now. That contrasts with a long-run average near 17 and a dot-com peak of 44. And, a supplementary metric, the Buffett Indicator, places the market’s total cap at roughly 240% of GDP; the real equity-risk premium is only ~1.1%; and institutional positioning is near record levels. Those are legitimate bubble indicators, particularly with AI investment still doing an enormous amount of economic and earnings-heavy lifting.
Staying on the bear side: Concentration risk also sits atop this pile. The IT sector now makes up 39% of the S&P 500's total market cap — above the dot-com peak of ~33%. Include Amazon and Netflix in that bucket and tech is half the entire index, compared to 29% at the dot-com top.
Margin debt also neared historic levels before July’s correction, another legitimately bearish signal to watch. Fortunately, that coil unwound quite a lot during the selloff, declining $85 billion during July, the largest intra-month deleveraging ever recorded. Still, it is something that could froth back up if market euphoria returns.
On the other side of the coin — the one with a bull on it — you have growth forecasts.
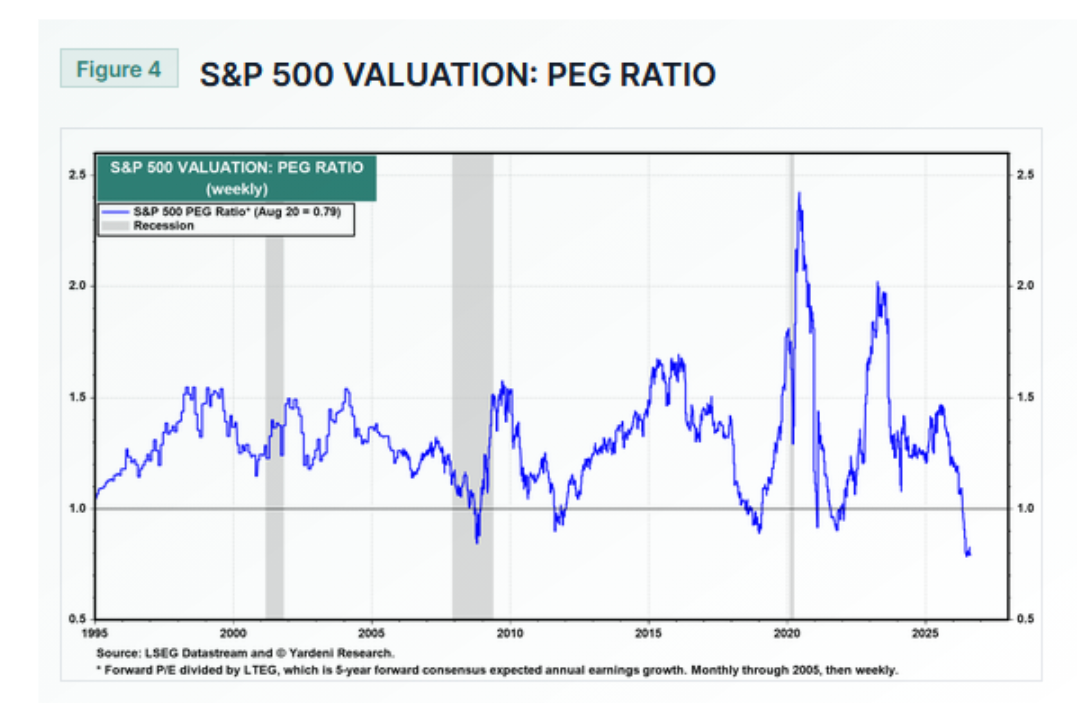
The S&P 500’s current PEG ratio compares the index’s value to future projected earnings growth (which S&P 500 companies have been smashing through recently) instead of past or present earnings, like the CAPE or a simple price-to-earnings snapshot. That metric, the PEG, sits near or at a historic low, meaning the market is incredibly cheap relative to projected growth.
And…if you follow the money that’s being poured into this growth, it looks like another supporting factor. Goldman Sachs' own baseline model, anchored to Wall Street's forward estimates for Nvidia's data-center revenue, projects $765 billion in annual AI capex for 2026, climbing to $1.6 trillion by 2031 — roughly $7.6 trillion cumulative over that stretch. That's a full-on, industrial-style buildout with a multi-year runway already priced in by the people actually writing the checks. Companies aren't only investing in AI expenditures; venture capital is also funding startups focused on it. AI companies have absorbed almost 90% of the United States’ VC capital so far in 2026.
But the bear case is that this all becomes self-defeating: AI investment growth peaks, supplier earnings slow, investors demand evidence that trillions of dollars of infrastructure can generate sufficient revenue, long-term rates remain punitive, and today's virtuous cycle reverses. Some hypothetical approximations are brutal: An eventual ~$5 trillion AI capital base may require $2 trillion+ of annual revenue to justify itself. Revolutionary technology can still produce terrible investments at the wrong price — the railroads got built; the internet worked; both booms still broke.
The binary outcome question, which will eventually be settled, is: Was this a genuine revolutionary growth period, or were markets just high on the hype? A lot of that depends on AI's staying power.
And, for now, the growth case remains in the driver’s seat. Corporate America keeps producing numbers that make today's prices look progressively less ridiculous. S&P 500 forward earnings estimates have risen roughly 23% YTD while the index is up ~11%, meaning earnings are actually outrunning stock prices. Q2 EPS growth is tracking around 33%, potentially one of the strongest non-recession-rebound quarters on record, with the steepest positive earnings-revision trajectory since at least 2000.
Consequently, the S&P's forward P/E has fallen from ~23.1x last October to ~20.1x today even while the index makes records. Equal-weight trades around 17.1x, while the Nasdaq 100's forward multiple is reportedly below its own 10-year average. That's a key distinction from the stereotypical bubble: Prices aren't becoming more detached from expected earnings; expected earnings are catching up faster than prices can run away.
And buyers are everywhere. Passive ETFs have absorbed approximately $1.6 trillion YTD, or $7.5 billion per day — 55% above the previous record pace; July alone brought nearly $350 billion, the largest month ever. Corporations have authorized more than $1 trillion of buybacks, also a record for this point in the year, with nearly 70% of the largest programs outside technology. Retail has returned as a net buyer. Asset managers hold roughly $375 billion of long S&P futures exposure, near a record, alongside record or near-record positioning in developed and emerging international equities. More than 70% of S&P constituents sit above their 200-day moving averages, while correlations between individual stocks are near historic lows.
And, pertinently: Both domestically and abroad, household net worth is becoming increasingly tied to equity growth valuations. People are investing more than ever — they’ve been taught to do so more consistently in recent years, and this AI boom is only adding fuel to the fire. That can be both a recipe for a massive unwinding or fuel for continued growth. Either way, markets are getting more attention than ever.
All of this makes the current market unusually difficult to label, and dangerous to forecast.
Absolute valuation says expensive; relative valuation is improving. CAPE says bubble; forward earnings say considerably less so. Concentration remains historically extreme, yet breadth is improving. AI investment may ultimately prove excessive, while the companies benefiting from it are presently printing very real profits. And unlike a classic euphoric melt-up driven by investors simply agreeing to pay progressively more for the same dollar of earnings, the S&P's valuation multiple is compressing while the market rises. That's almost the opposite mechanism.
The risk has migrated from “are these earnings real?” toward “how long can these earnings remain this good?”
If AI capex growth slows in 2027, supplier margins contract, long-term yields keep rising, or the monetization needed to justify the infrastructure never arrives, today's earnings denominator can deteriorate remarkably quickly—and suddenly 20x forward earnings was cheap only because the “E” was wrong.
But that's the unresolved contradiction: the market looks historically expensive backward, considerably more ordinary forward, and increasingly supported by actual cash flows and an extraordinary amount of money still looking to buy it.
Answers to your questions
Yes. Origin offers partner access so you can manage your finances together at no additional cost. You’ll be able to filter transactions by member—making it easy to see which spending is yours and which belongs to your partner.

Yes. You can edit existing transactions and add new ones directly in Origin, so your records stay accurate and personalized.
Origin connects securely through trusted partners including Plaid, MX, and Mastercard.
Yes. Origin supports CSV uploads. You can upload a .csv file of your transactions, and we’ll import them into your account.
Yes. Your data is protected with bank-level security and advanced encryption. When you connect accounts through Origin, your login credentials are never shared with us. Instead, our partners generate secure tokens that let Origin access only the data you authorize—keeping your personal information private while enabling personalized insights.
Yes. You have full control to organize your spending in Origin. Transactions are automatically categorized by Origin, but you can always edit categories, add your own tags, and filter transactions however you like—so your spending reflects the way you actually manage money.