Our New Advanced Reports Feature Lets You Drill Down Into Your Spending Trends


We are super excited to be launching one of our most-requested features: advanced reports. What does that mean? As an Origin member, you’ll now be able to drill down into your data and generate custom reports that examine your spending trends.
You can filter your reports based on timeframe, accounts (like specific credit cards or bank accounts), categories, merchants, and transaction amounts.
Even better? Once they’re generated, these analyses are super clean and easy to read, and you can pick from a handful of visualization methods to further customize your report.
Get started with advanced reports today.
Here are some of the types of queries our new advanced reports can answer:
- How much have I spent on my Chase Sapphire card over the past six months?
- What is my cash flow looking like after my trip to Hawaii?
- How much have I spent on Lyft and Uber over time?
- How has my spending changed in specific categories over time?
- Which credit card do I use the most?
- What month this year did I spend the most?
- Have I been eating out more or less in the past 90 days?
- How’s my income changed since I switched to part-time work?
- What’s my net cash flow for the year look like?
- How much did I transfer to investment accounts last month?
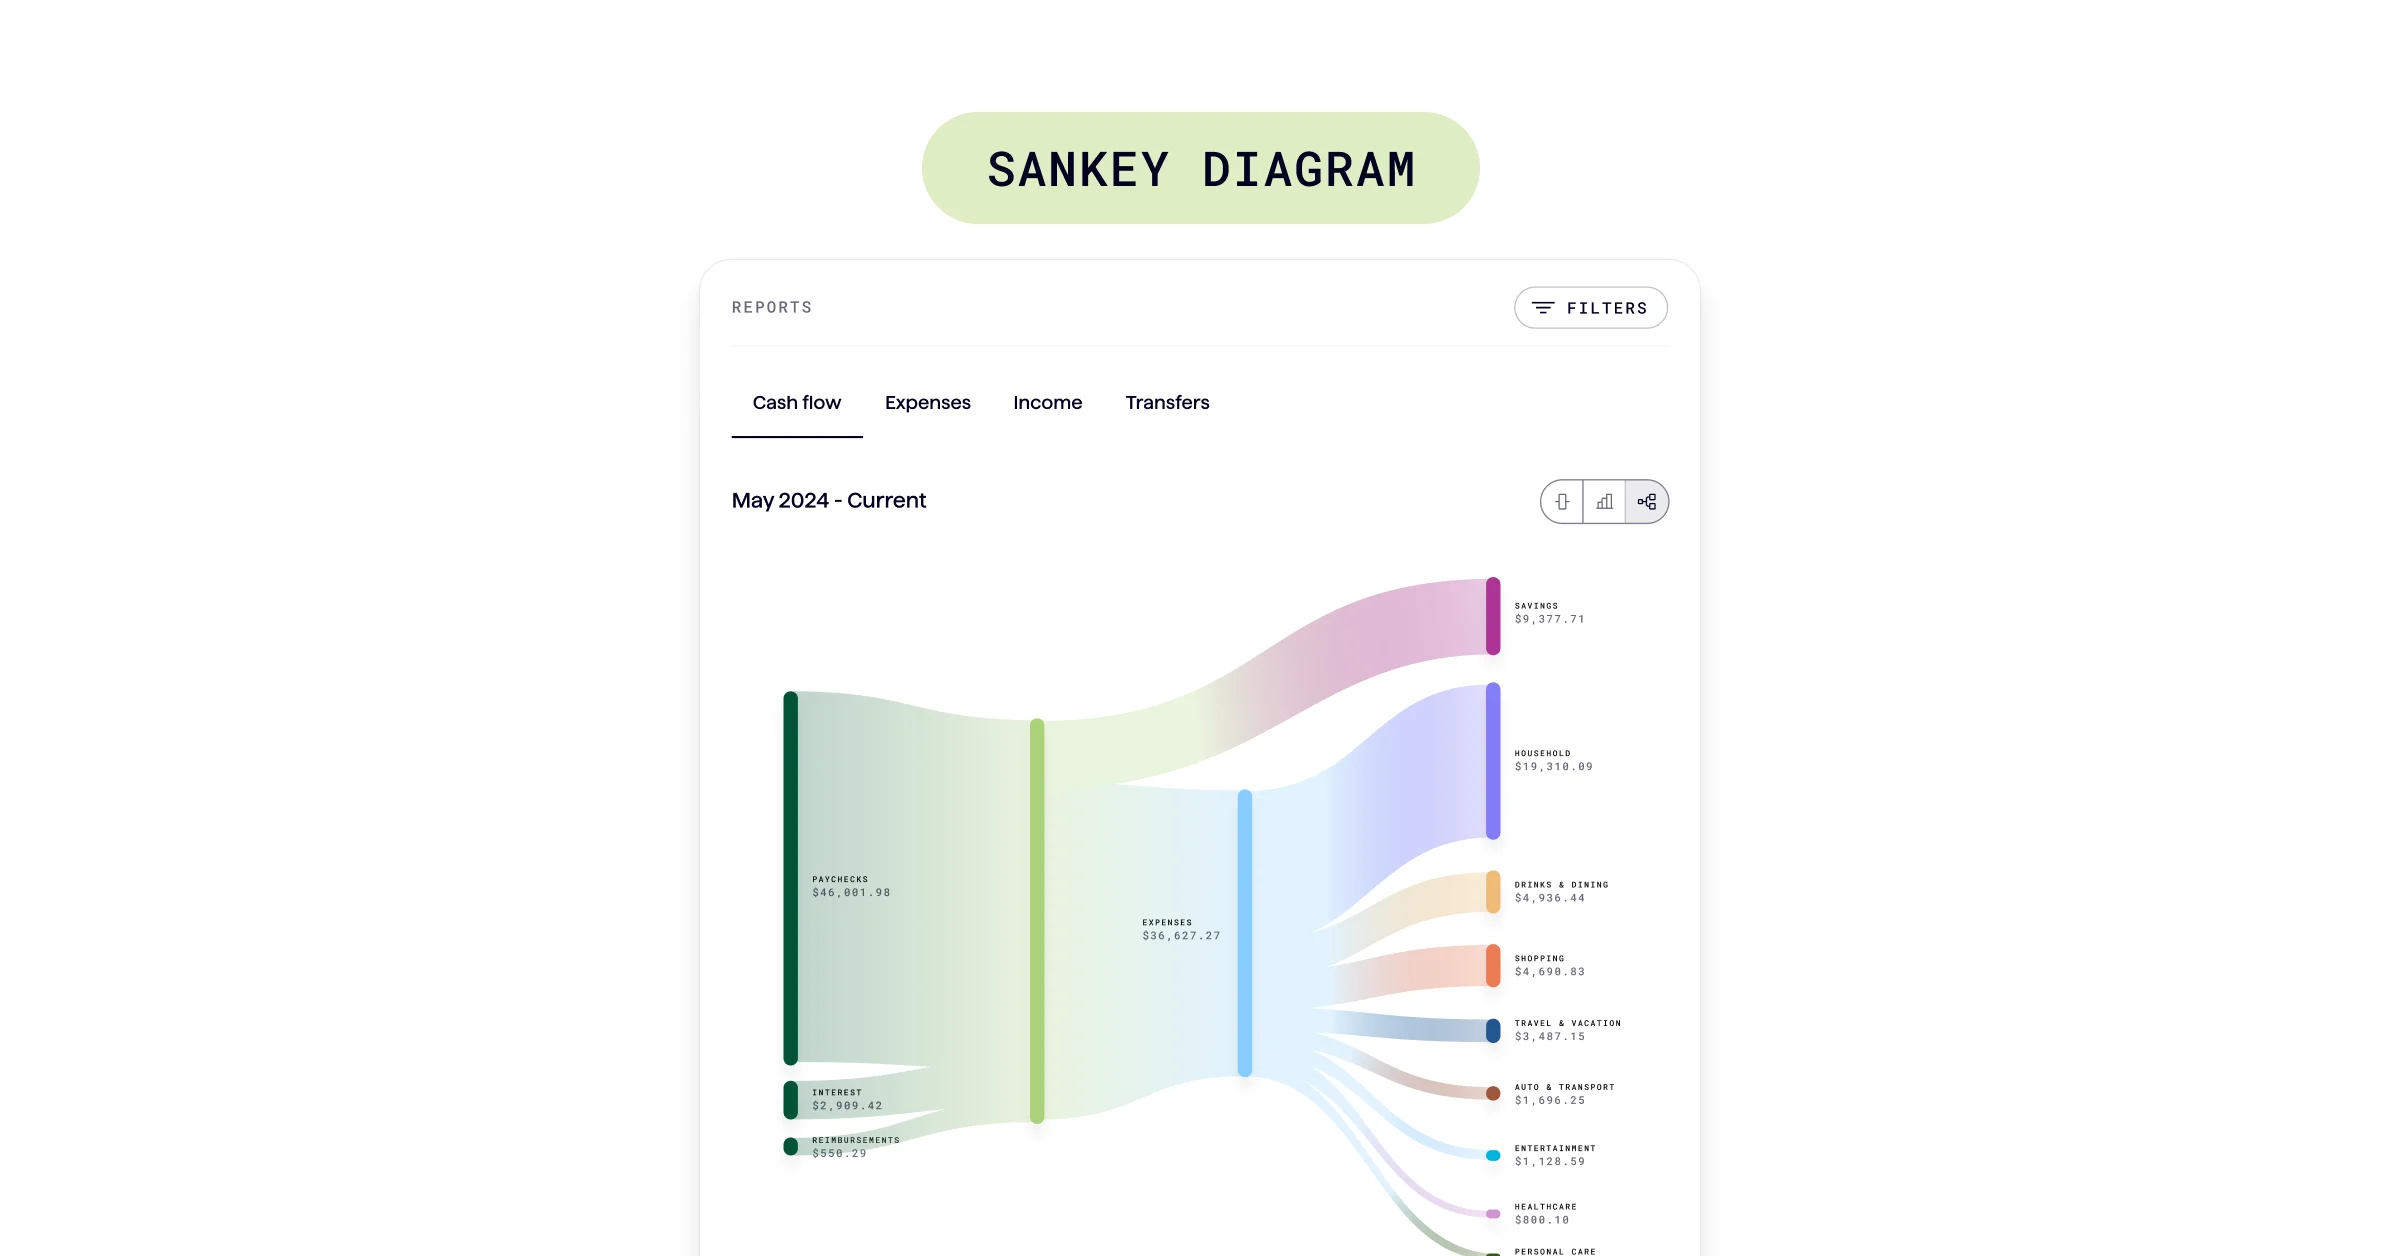
How you can visualize your spending trends
For cash flow reports, you’ve got a bunch of different visualization options: Stacked bar charts, side-by-side bar charts, and Sankey diagrams.
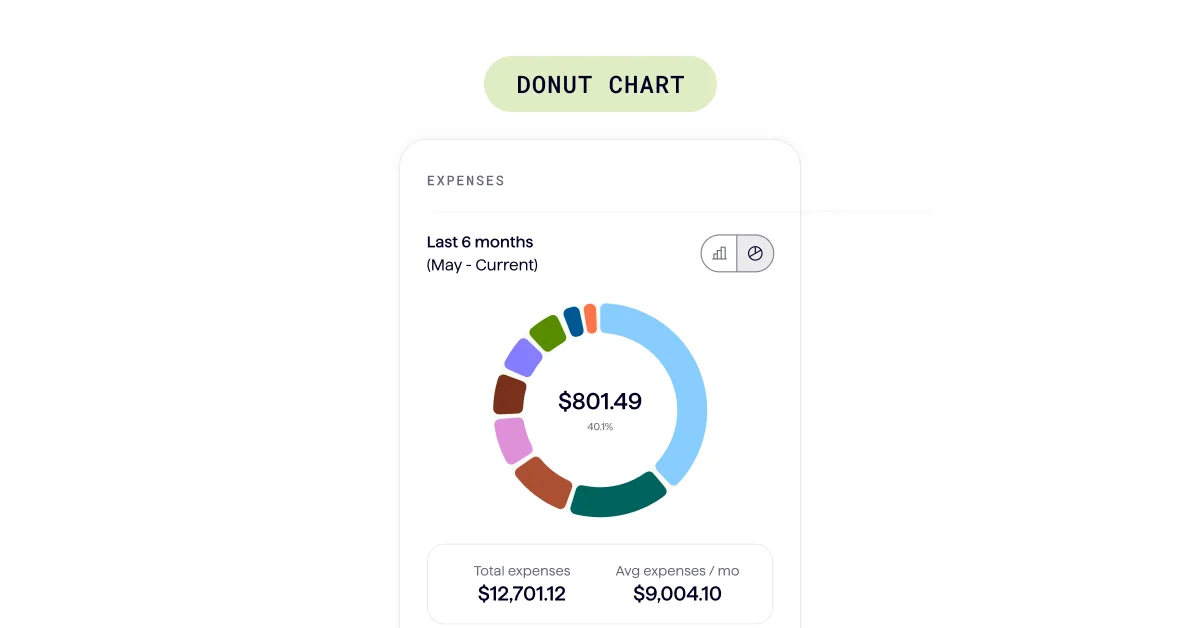
For reports on your expenses, you can visualize your data in a stacked bar chart, or in a donut diagram.
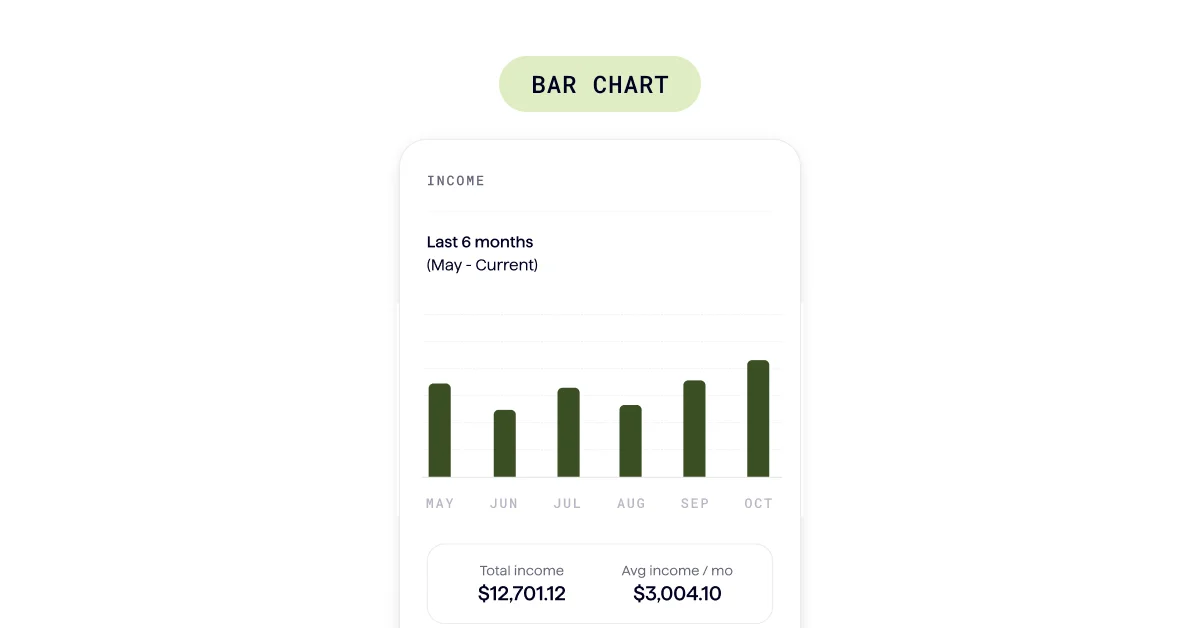
For income reports, your data is automatically visualized in a bar chart.
For reports on your transfers, your data is automatically visualized in a waterfall money-in vs. money-out bar chart.
Custom reporting has been one of our top requests, and we’re so excited that it’s live for all members starting today. Check out a full walkthrough of the feature here.
We can’t wait for you to get an even better understanding of your spending trends with this new feature. Give it a go, and let us know what you think.
Answers to your questions
Yes. Origin offers partner access so you can manage your finances together at no additional cost. You’ll be able to filter transactions by member—making it easy to see which spending is yours and which belongs to your partner.

Yes. You can edit existing transactions and add new ones directly in Origin, so your records stay accurate and personalized.
Origin connects securely through trusted partners including Plaid, MX, and Mastercard.
Yes. Origin supports CSV uploads. You can upload a .csv file of your transactions, and we’ll import them into your account.
Yes. Your data is protected with bank-level security and advanced encryption. When you connect accounts through Origin, your login credentials are never shared with us. Instead, our partners generate secure tokens that let Origin access only the data you authorize—keeping your personal information private while enabling personalized insights.
Yes. You have full control to organize your spending in Origin. Transactions are automatically categorized by Origin, but you can always edit categories, add your own tags, and filter transactions however you like—so your spending reflects the way you actually manage money.


